What is MS Excel? It’s Microsoft’s spreadsheet software that lets you organize, calculate, and visualize data in a powerful yet flexible grid of rows and columns. Used by millions worldwide, Excel is the backbone of budgeting, reporting, and data analysis in 2025.
As someone who has helped countless students and professionals get started with Excel, I’ve seen both the excitement and the frustration it can bring. At first, the formulas, charts, and endless cells may feel intimidating. But once you learn the basics, Excel becomes a tool that saves hours of work and unlocks smarter decision-making.
In this beginner-friendly guide, you’ll discover:
-
The core features that define MS Excel and how they work.
-
A quick tour of Excel’s interface and layout.
-
Practical, real-world examples of Excel in action.
-
Tips and best practices to avoid common beginner mistakes.
Don’t worry if you’ve never used a spreadsheet before. By the end, you’ll understand what MS Excel is and how to start using it confidently in 2025.
What Is MS Excel Used For? Core Features Explained
To fully answer what is MS Excel, it is spreadsheet software that helps users enter, calculate, analyze, and visualize data in a grid format. It is widely used for tasks ranging from budgeting to advanced financial modeling.
Core Features of MS Excel (2025 Overview)
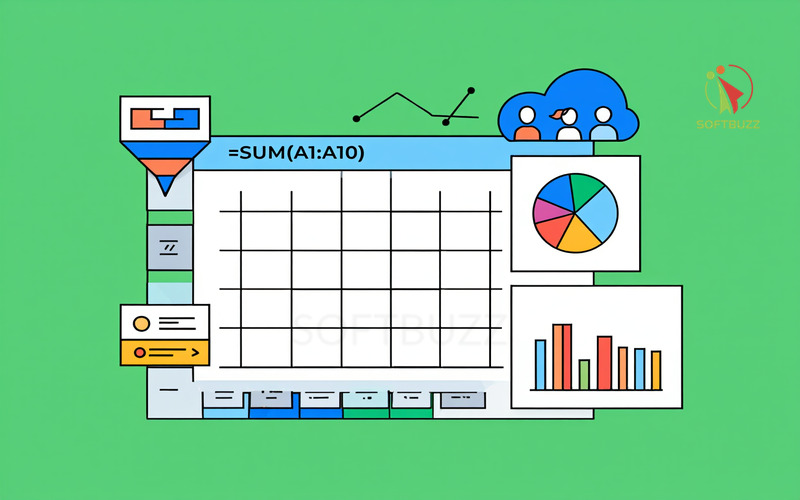
MS Excel is used to input data, run formulas, generate charts, sort/filter information, and collaborate in real time via the cloud.
-
Worksheets & Workbooks – Excel files are called workbooks, and each workbook can contain multiple worksheets (tabs). This structure helps manage related datasets in one file.
-
Grid of Cells – A worksheet consists of rows and columns forming cells. Each cell can store numbers, text, or formulas, making Excel highly flexible.
-
Formulas & Functions – Users perform calculations with formulas (e.g., =A1+B1) and functions like
SUM,AVERAGE, orIF. These automate tasks and minimize manual effort. -
Charts & Graphs – Built-in visualization tools (bar, line, pie, scatter) transform raw data into clear insights and presentations.
-
Sorting & Filtering – Data can be sorted alphabetically, numerically, or filtered to focus only on relevant information.
-
Collaboration Tools – Cloud integration with OneDrive and SharePoint allows multiple users to work on the same file simultaneously, improving version control and teamwork. For extra data protection, many teams combine Excel with cloud backup solutions to ensure files are never lost.
Quick Feature Matrix
These features summarize what Excel can do and explain the common uses of Microsoft Excel in 2025.
| Feature | Purpose | Example Use Case |
|---|---|---|
| Worksheets/Workbooks | Organize multiple datasets in one file | Track sales, expenses, and inventory tabs |
| Grid of Cells | Store text, numbers, formulas | Budget planner or grade sheet |
| Formulas & Functions | Automate calculations and analysis | =SUM(A1:A10) for total expenses |
| Charts & Graphs | Visualize data trends | Sales growth line chart |
| Sorting & Filtering | Manage and clean data quickly | Show only orders above $500 |
| Collaboration | Work together online | Shared financial reports in OneDrive |
Real-World Example
A small business owner can:
-
Enter daily sales into a worksheet.
-
Use formulas to calculate monthly totals.
-
Create bar charts to visualize revenue trends.
-
Share the file on OneDrive so the accountant updates expenses in real time.
This shows how Excel scales from simple record-keeping to collaborative business analysis, making it a must-have tool across industries.
Taking a Tour: MS Excel’s User Interface for Beginners
If you are new and wondering what is MS Excel, the first step is to understand its interface. The MS Excel layout is designed to help users work with data efficiently. Knowing the core components makes it easier for beginners to enter information, apply formulas, and create reports without confusion.
Ribbon and Menu Tabs
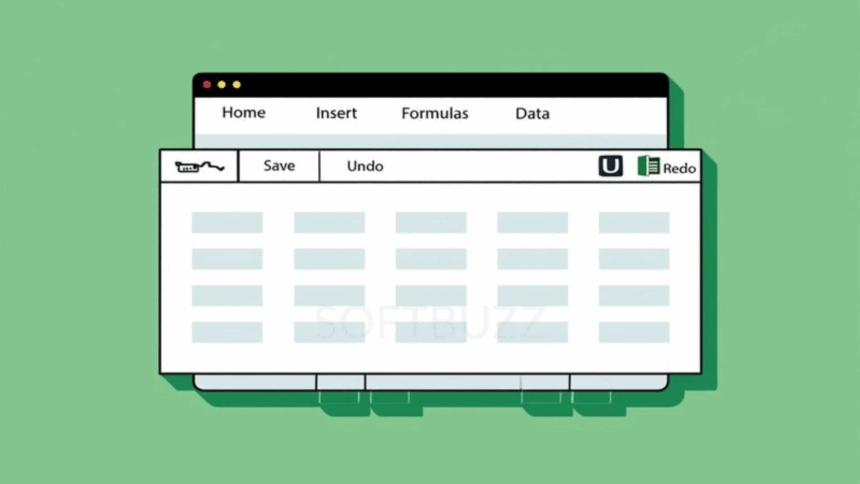
The ribbon in Microsoft Office Excel is a toolbar divided into tabs such as Home, Insert, Formulas, and Data. Each tab groups commands for formatting, calculations, or data management.
For beginners, starting with the Home tab provides quick access to basic tools like formatting, copy-paste, and number styles.
Quick Access Toolbar
The Quick Access Toolbar sits above or below the ribbon and provides one-click access to actions like Save, Undo, or Redo.
Customizing this toolbar is especially useful in Microsoft Office Microsoft Excel, where frequent tasks can be saved as shortcuts.
Worksheet Grid
A worksheet grid is the heart of an Excel file. It consists of rows and columns that intersect to form cells, each capable of holding text, numbers, or formulas.
Beginners often ask what is an Excel file—the answer is simple: it’s a Microsoft Office Excel workbook containing one or more worksheets organized in this grid.
Formula Bar
The formula bar sits above the worksheet grid and displays the content of the active cell, including formulas.
Watching the formula bar helps users see how Excel calculates results, making it easier to learn what does Excel do in practice.
Sheet Tabs
Sheet tabs appear at the bottom of the window, allowing users to add, rename, or navigate worksheets inside a workbook.
This feature shows what Excel is used for: keeping multiple datasets like monthly sales or class grades in a single file.
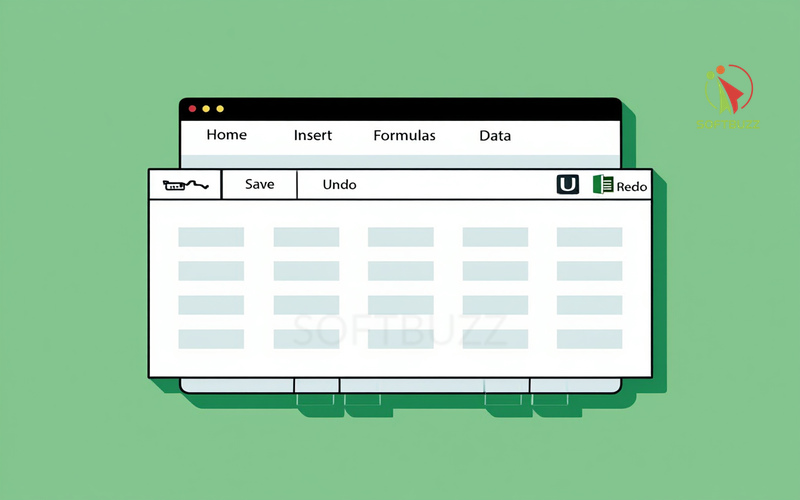
Quick Feature Matrix of the Interface
| Component | Location | Purpose | Beginner Tip |
|---|---|---|---|
| Ribbon/Menu Tabs | Top of the window | Groups Excel commands into categories | Use Home tab for basic formatting |
| Quick Access Toolbar | Above/below the ribbon | Shortcuts for frequent tasks | Add Save and Undo for speed |
| Worksheet Grid | Center of the workbook | Stores numbers, text, and formulas | Think of it as your main workspace |
| Formula Bar | Above the grid | Shows and edits active cell content | Watch it when entering formulas |
| Sheet Tabs | Bottom of the workbook | Organize multiple worksheets | Use separate sheets for each dataset |
Real-World Example
Imagine a small business owner who needs to track sales:
-
They enter daily revenue into the worksheet grid.
-
The formula bar helps calculate totals.
-
Each month is stored on separate sheet tabs within the same workbook.
-
The ribbon provides quick access to charts for visualizing trends.
This simple example demonstrates what Excel can do: organize, calculate, and present data in ways that make decision-making easier.
How Does MS Excel Work? Essential Concepts for New Users
To understand what is MS Excel, it helps to know that it works by organizing information into a grid of rows and columns where each cell can store and process data. Unlike a simple text file, Excel combines storage with real-time calculations, making it more powerful than basic databases for everyday users.
Understanding the Spreadsheet Grid
-
The grid is formed by rows (numbered) and columns (lettered).
-
Each cell (e.g., A1, B2) can hold numbers, text, dates, or formulas.
This structure explains what Excel can do: store data and perform calculations dynamically.
Cell Referencing in Excel
Cell referencing is the core concept behind formulas. It tells Excel which cells to use when performing calculations.
-
Example:
=A1+B1adds the values in A1 and B1. -
Example:
=SUM(A1:A3)totals a range of three cells.
This shows the practical side of what is the MS Excel: a tool that computes values based on cell references.
Relative vs. Absolute References
| Reference Type | Description | Example |
|---|---|---|
| Relative | Changes when copied to another cell | =A1+B1 |
| Absolute | Fixed; doesn’t change when copied elsewhere | =$A$1+$B$1 |
Knowing the difference helps beginners understand what Excel is used for in creating flexible or fixed calculations.
Simple Formula Example
To add two values in Excel:
-
Click the cell where you want the result (e.g., C1).
-
Type
=A1+B1in the formula bar. -
Press Enter to see the sum.
This step-by-step process demonstrates uses of Microsoft Excel in everyday tasks like budgeting, grades, or expense tracking.
How MS Excel Processes Data
| Step in Excel | What Happens | Example Use Case |
|---|---|---|
| Enter data in cells | Numbers, text, or dates are stored | Monthly expenses |
| Apply formulas | Excel calculates automatically | =A1+B1 for totals |
| Use functions | Prebuilt tools simplify complex tasks | =AVERAGE(B1:B10) for grades |
| Reference cells | Formulas pull values from specific cells | Linking sheets in a workbook |
| Display results | The formula bar and cell show outcomes | Chart of total sales |
Real-World Example
A teacher tracking student grades might:
-
Enter scores into the worksheet grid.
-
Use
=AVERAGE()to calculate class averages. -
Apply absolute references to lock the grading scale.
-
Generate a bar chart to compare results.
This illustrates ms excel what is: not just a table, but a dynamic tool that calculates, summarizes, and visualizes data instantly.
Real-World Uses and Examples of MS Excel
MS Excel is used for a wide variety of tasks, from simple budgeting to advanced business analysis. Its versatility makes it essential for both personal and professional contexts.
Common Uses of Microsoft Excel
-
Budgeting and Home Finances – Excel is used to track expenses, income, and savings goals. Tables and charts make financial planning visual and simple.
-
Business and Accounting – Companies rely on Excel to manage invoices, monitor cash flow, generate financial statements, and analyze sales trends.
-
Project Tracking and Inventory – Teams use Excel to keep schedules, track deliverables, and maintain inventory lists with sorting and filtering.
-
Education – Teachers and students use Excel to record grades, attendance, and build study plans efficiently.
In short, what Excel is used for spans across finance, business, education, and project management.
What to Use Excel For
| Scenario | How Excel Helps | Example Task |
|---|---|---|
| Personal Budgeting | Track income/expenses, visualize savings | Monthly household budget sheet |
| Small Business | Analyze revenue, generate invoices | PivotTable for quarterly sales |
| Project Management | Monitor timelines, tasks, and resources | Gantt-style project tracker |
| Education | Record, calculate, and visualize student data | Gradebook with average calculations |
These highlights explain the uses of Microsoft Excel in real-life situations.
Real-Life Examples
-
Maria, a college student, uses Excel to log monthly expenses and visualize her spending with pie charts.
-
Sam, a small business owner, uses Excel tables and PivotTables to track inventory and monitor sales performance.
These cases show that Excel is used for both everyday personal needs and complex business analysis.
Getting Started with Templates
For beginners wondering what to use Excel for, Microsoft and online communities offer ready-made templates:
-
Budget planners
-
Invoice trackers
-
Project management sheets
-
Gradebooks
Templates provide quick starting points, allowing new users to apply Excel’s features without building files from scratch.
What Sets MS Excel Apart? Key Advantages and Unique Features
Microsoft Excel stands out in the Microsoft Office suite because it combines advanced data analysis with flexibility. For anyone asking what is Excel Microsoft or what is MS Excel used for beyond basics, these features explain why it remains the global standard in 2025.
Key Advantages of Microsoft Office Excel
-
PivotTables – Summarize large datasets instantly and highlight key trends.
-
Advanced Data Visualization – Use conditional formatting, charts, and graphs to transform numbers into insights.
-
Robust Data Import/Export – Work with multiple file formats (XLSX, CSV, XML, JSON) for seamless integration across systems.
-
Deep Formula Library – Access thousands of built-in functions covering finance, statistics, and engineering.
-
Multi-Device Cloud Collaboration – Share and edit files in real time via OneDrive, avoiding version conflicts.
-
Extensibility – Automate tasks with macros, or add new functions via plugins.
-
Accessibility & Platform Support – Available on Windows, macOS, web, and mobile with features like screen readers and keyboard shortcuts.
In short, Microsoft Office Microsoft Excel delivers powerful analysis tools, automation, and cross-platform flexibility unmatched by most competitors. Advanced automation features like Excel Power Query make it easy to clean and transform large datasets before analysis.
Why Excel Outperforms Alternatives
| Feature/Capability | Microsoft Excel | Google Sheets | LibreOffice Calc |
|---|---|---|---|
| PivotTables & Data Models | Full support for advanced analytics | Basic pivot options | Limited pivot functionality |
| Formula Library | 400+ functions including VBA macros | Fewer functions, no VBA | Moderate but less extensive |
| Visualization | Conditional formatting + 20+ chart types | Limited chart options | Basic visual tools |
| File Compatibility | Wide (CSV, XML, JSON, XLS, XLSX) | Limited export formats | Decent compatibility |
| Collaboration | Real-time with OneDrive & SharePoint | Strong in cloud collaboration | Minimal support |
| Performance with Big Data | Handles larger, complex datasets | Struggles with very large datasets | Moderate but slower |
This table shows what MS Excel can do that free alternatives struggle with: advanced formulas, automation, and handling big datasets.
Real-World Example
-
Finance teams rely on PivotTables and macros to close monthly reports faster.
-
Data analysts prefer Excel’s deep formula library and conditional formatting to model business outcomes.
-
Educators and students use Excel templates and charts for projects, where collaboration via OneDrive ensures no data loss.
These cases highlight the uses of Microsoft Excel in different industries, showing why it remains the first choice despite free alternatives like Google Sheets.
Why Excel Still Leads in 2025
While Google Sheets is popular for free cloud collaboration, MS Excel continues to dominate professional environments. It offers deeper analytics, offline capability, and unmatched flexibility in managing data models. For anyone evaluating what Excel is used for in business or academics, Excel delivers the power needed for both simple tasks and advanced data operations.
How to Get Started With MS Excel: Simple Steps for Beginners
Using MS Excel effectively requires more than just knowing formulas—it’s about working smart and keeping your data safe. These best practices show beginners exactly what Excel is used for in 2025: efficient organization, error prevention, and secure collaboration.
1. Organize Your Workbook
-
Name worksheets clearly (e.g., “Budget_2025” instead of “Sheet1”).
-
Convert raw ranges into Excel Tables for easier filtering and sorting.
-
Avoid unnecessary merged cells, which often cause broken formulas.
A tidy Microsoft Office Excel workbook makes analysis faster and less error-prone.
2. Save and Backup Regularly
-
Enable AutoSave in Microsoft 365 Excel.
-
Keep a backup in OneDrive or SharePoint for cloud recovery.
-
Export important files to CSV or PDF for extra safety.
Microsoft documentation highlights “save early and often” as the #1 habit to prevent data loss.
3. Use Data Validation for Accuracy
-
Restrict cell entries to numbers, dates, or lists.
-
Stop invalid values from breaking formulas.
This practice reinforces the uses of Microsoft Excel for building reliable datasets.
4. Learn Essential Keyboard Shortcuts
-
Ctrl+C → Copy
-
Ctrl+Z → Undo
-
F2 → Edit the active cell
Shortcuts reflect one of the most common uses of Excel: saving time in repetitive tasks.
Learning shortcut keys in MS Excel improves speed and helps beginners save hours of work.
5. Handle Macros With Care
-
Enable macros only from trusted sources.
-
Review code before running automated scripts.
-
Follow IT or company security policies for macro-enabled files.
Macros are powerful, but misuse can compromise security.
6. Collaborate the Smart Way
-
Share files via OneDrive or SharePoint instead of sending email attachments.
-
Apply permissions (View vs Edit) appropriately.
-
Protect sensitive sheets with passwords.
Secure collaboration ensures teamwork without losing control of your data.
Key Takeaway
By following these practices, beginners avoid common pitfalls such as lost files, formula errors (#DIV/0!), or accidental overwrites. In essence, this is what MS Excel is: not just a spreadsheet tool, but a secure and reliable platform for data management, collaboration, and productivity.
MS Excel Tips, Best Practices, and Safety Guidelines for New Users
Understanding what is MS Excel is only the first step—using it efficiently and safely requires following proven best practices. These guidelines explain what Excel is used for in daily work, from data accuracy to secure collaboration.
Organize Data Effectively
-
Use descriptive worksheet names (e.g., “2025_Budget” instead of “Sheet1”).
-
Convert ranges into Excel Tables for easier analysis.
-
Avoid excessive merged cells, which often break formulas.
A clean Microsoft Office Excel workbook reflects not just what is MS Excel but how it should be used for reliable reporting.
Save and Backup Frequently
-
Enable AutoSave in Microsoft 365 Excel.
-
Sync files with OneDrive or SharePoint for cloud protection.
-
Export critical sheets as CSV or PDF.
One of the most important uses of Microsoft Excel is protecting business-critical data from loss.
Validate Inputs for Accuracy
-
Apply Data Validation rules to restrict entries.
-
Prevent invalid values from corrupting calculations.
This ensures what MS Excel is designed for—accurate, consistent data handling.
Master Essential Shortcuts
-
Ctrl+C → Copy
-
Ctrl+Z → Undo
-
F2 → Edit active cell
Efficiency is part of what Excel is used for: speeding up repetitive workflows.
Be Careful with Macros
-
Enable macros only from trusted sources.
-
Review code before executing automated tasks.
-
Follow IT security policies when using macro-enabled workbooks.
Collaborate Securely
-
Share workbooks via OneDrive or SharePoint.
-
Assign appropriate permissions (View vs Edit).
-
Protect important sheets with passwords.
Collaboration is a core answer to what is MS Excel: a tool for teamwork as much as individual analysis.
Key Takeaway
Following these best practices shows not just what is MS Excel, but why it remains vital in 2025. Beginners who organize data, validate inputs, save securely, and collaborate wisely will avoid common mistakes such as lost files, broken formulas (#DIV/0!), or unintended overwrites. Ultimately, the uses of Microsoft Excel prove it is more than a spreadsheet—it is a secure and reliable platform for modern productivity.
Supplemental Answers: Common Questions About MS Excel
Here are the most frequently asked questions about MS Excel, designed to give beginners quick, clear answers.
Q1: Is MS Excel free?
A: MS Excel is typically part of a Microsoft 365 subscription or available as a one-time purchase. However, a free web-based version with limited features is accessible via OneDrive.
Q2: What is the difference between Excel and Google Sheets?
A: MS Excel provides advanced formulas, larger data handling, offline access, and more professional features. Google Sheets, on the other hand, excels at real-time online collaboration and ease of access across devices.
Q3: What file types can Excel open and save?
A: An Excel file—known as a Microsoft Office Excel workbook—supports formats such as XLSX, XLS, CSV, XML, TXT, and can export to PDF.
Q4: Can Excel handle big data?
A: Excel manages moderately large datasets well, making it suitable for most businesses. But for extremely large or complex datasets, specialized BI tools or databases are recommended.
Q5: Why isn’t my formula working?
A: Common issues include incorrect syntax, mismatched data types, or circular references. Reviewing formula structure and checking cell references usually resolves the error.
Q6: What is the MS Excel used for in daily work?
A: MS Excel is used for budgeting, financial analysis, project tracking, data visualization, and education. These uses of Microsoft Excel make it one of the most versatile productivity tools.
Q7: What can Excel do that other tools can’t?
A: Excel can combine powerful formulas, PivotTables, charts, and macros in a single file. This makes it unique compared to simpler spreadsheet or note-taking tools.
Q8: What is an Excel file exactly?
A: An Excel file is a digital workbook containing one or more worksheets. Each worksheet stores data in rows and columns, enabling structured storage, calculations, and reporting.
Q9: What is MS Excel in simple terms?
A: MS Excel is Microsoft’s spreadsheet software used worldwide to calculate, analyze, and visualize data.
Conclusion
In summary, knowing what is MS Excel and what Excel is used for helps users unlock its full potential in 2025. Knowing what MS Excel is and how to use it effectively is the first step toward building confidence with data in today’s digital world. You don’t have to feel overwhelmed by formulas or endless grids. By applying the basics in this guide, you can organize data, run calculations, and create clear reports with ease.
To sum it up, here are the key points to remember:
-
What is MS Excel? A versatile spreadsheet tool for organizing, calculating, and visualizing data.
-
What Excel is used for: budgeting, project tracking, financial analysis, and education.
-
Core features: workbooks, formulas, charts, and PivotTables turn raw data into insights.
-
Best practices: saving often, validating inputs, and collaborating securely prevent common mistakes.
Don’t underestimate the power of Excel skills. Mastering these fundamentals not only boosts productivity but also prepares you for advanced uses of Microsoft Excel, from automation with macros to large-scale analysis.
Whether for study, business, or personal projects, mastering what is MS Excel is essential in 2025.
For more practical tutorials and tips, explore the Computer trick category. And don’t forget to visit the Softbuzz homepage for the latest guides and resources across all topics.

